
Exchange report · 01
Pacifica Exchange Report
Scale, capital efficiency, fees, money flows and who trades — from public APIs and Solana on-chain data
Red flags
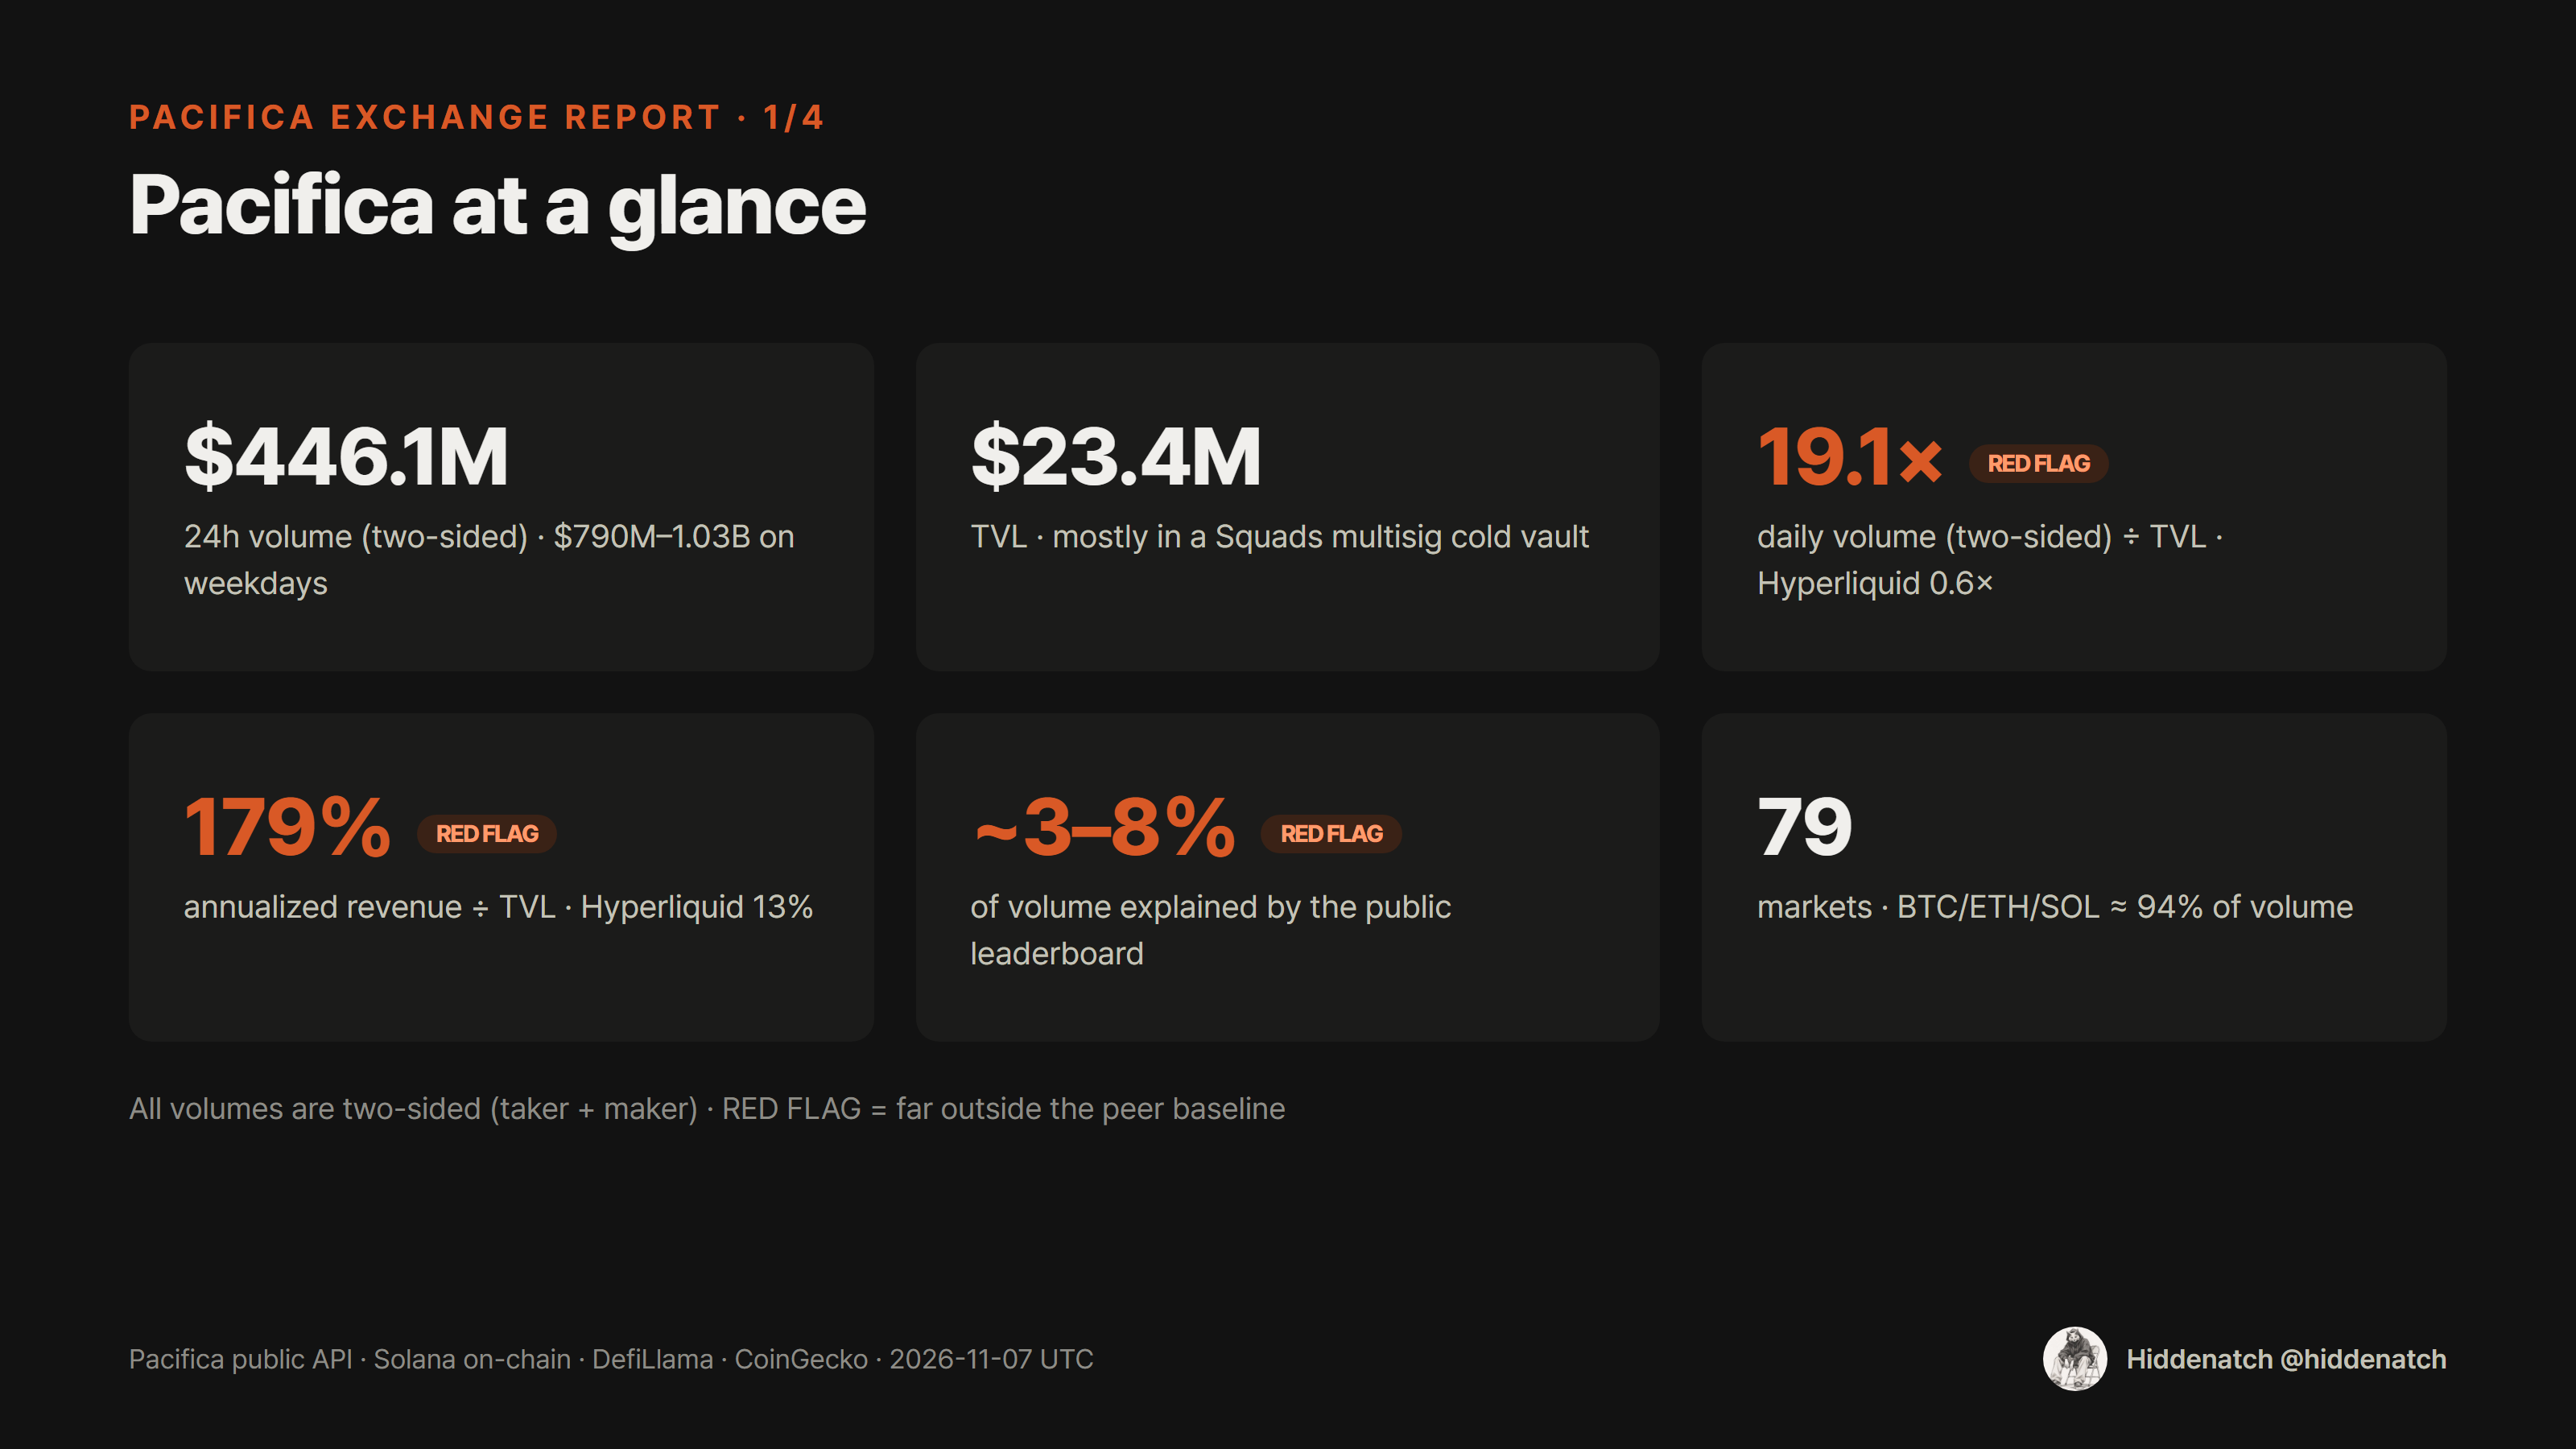
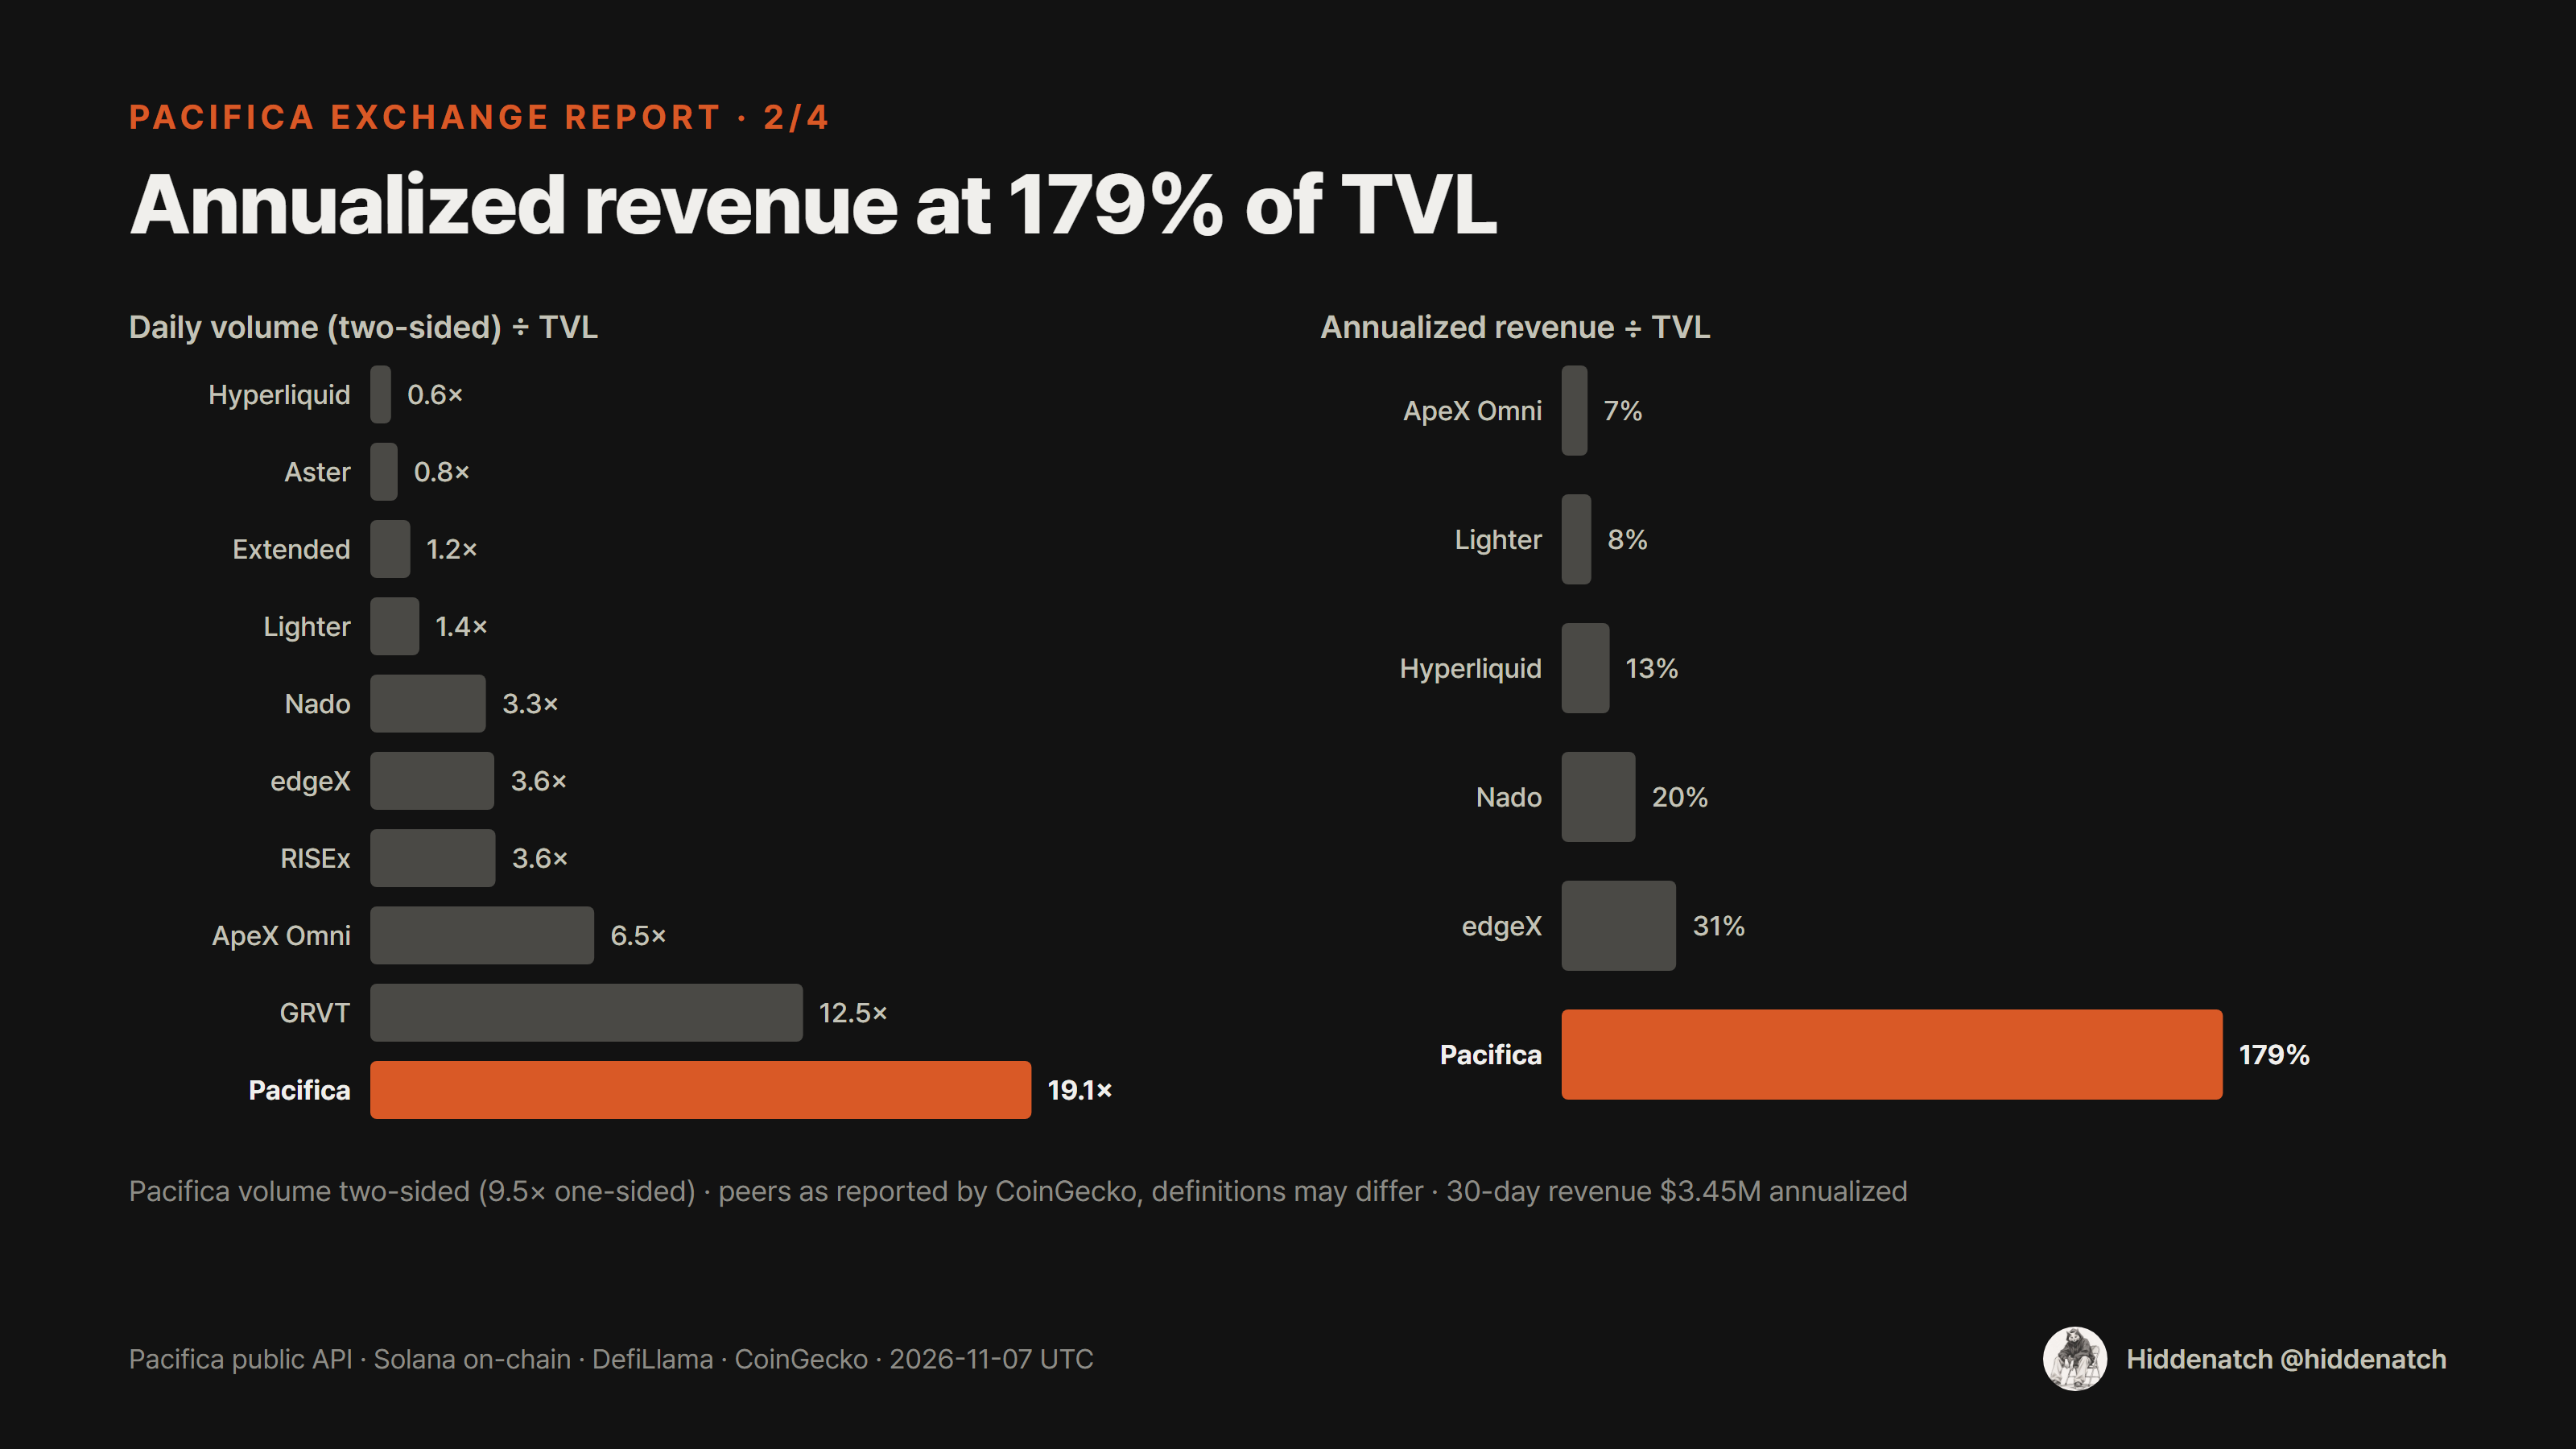
- Revenue is abnormally large relative to deposits. Annualized revenue is 179% of TVL — about 14× Hyperliquid (13%) and 6× edgeX (31%). Fees over the last 30 days alone equal about 15% of TVL.
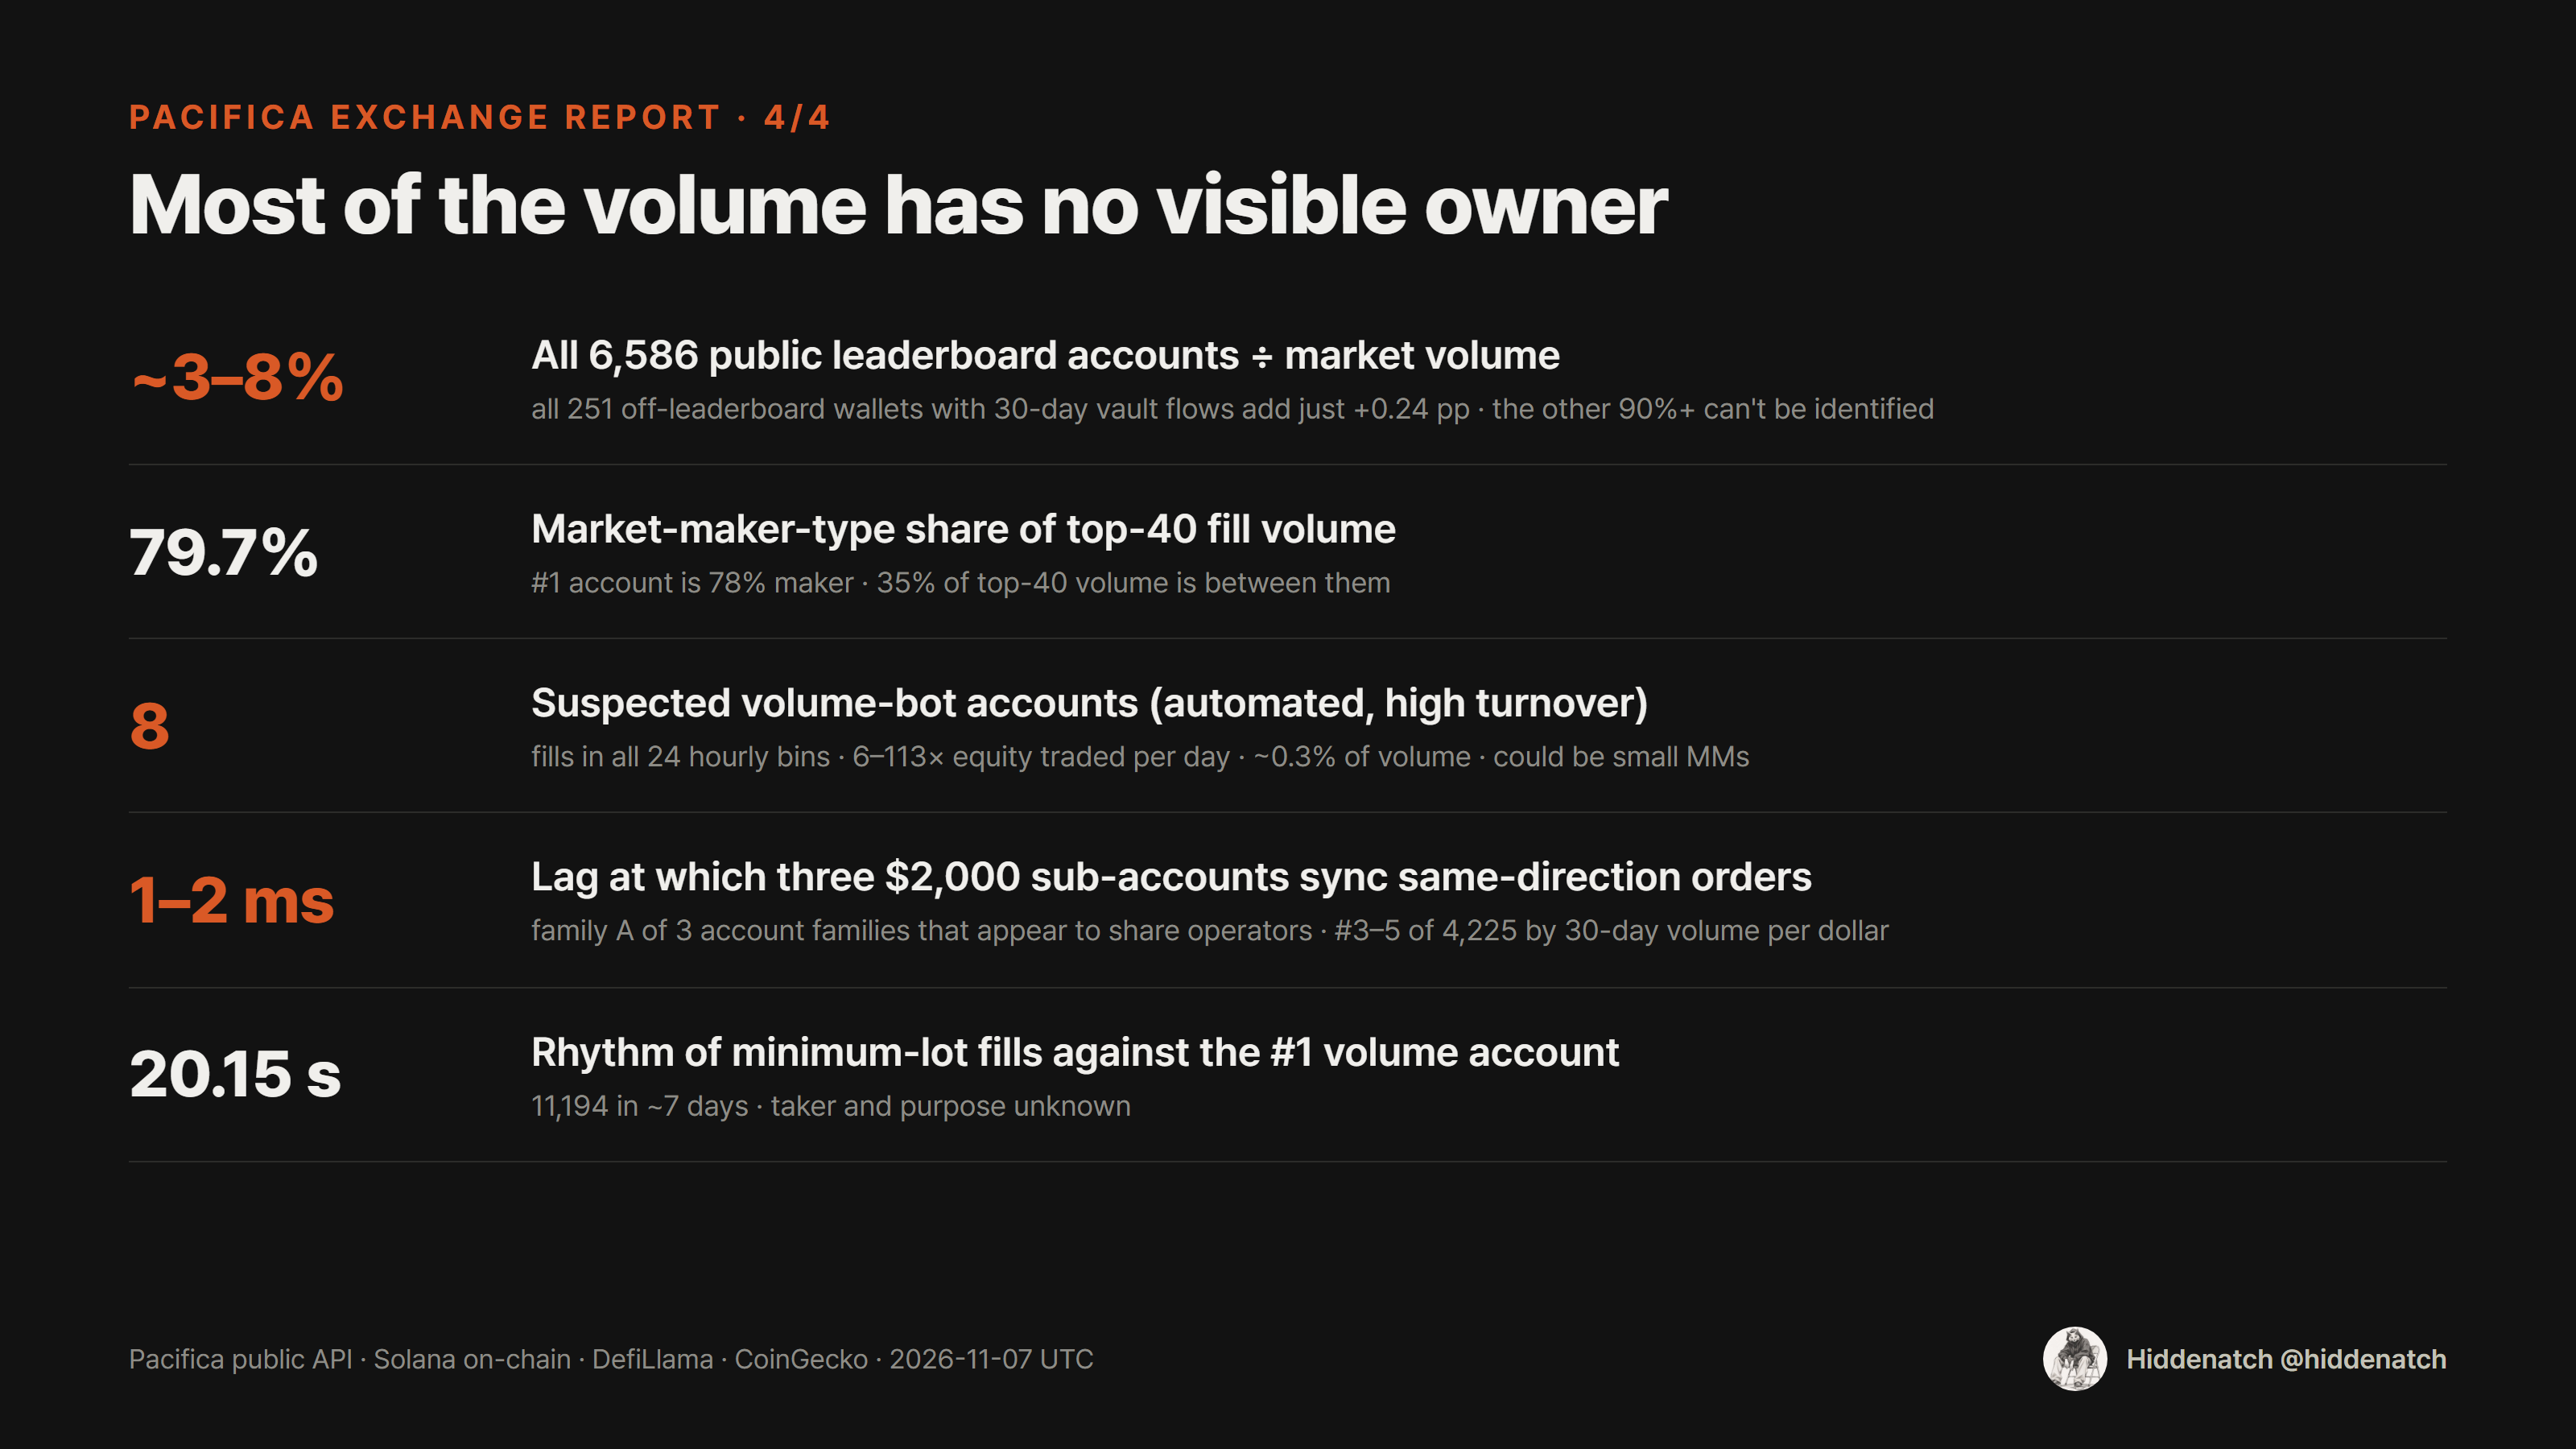
- Most volume has no visible owner. All 6,586 public leaderboard accounts add up to about 3–8% of market volume. The remaining accounts cannot be identified through public endpoints.
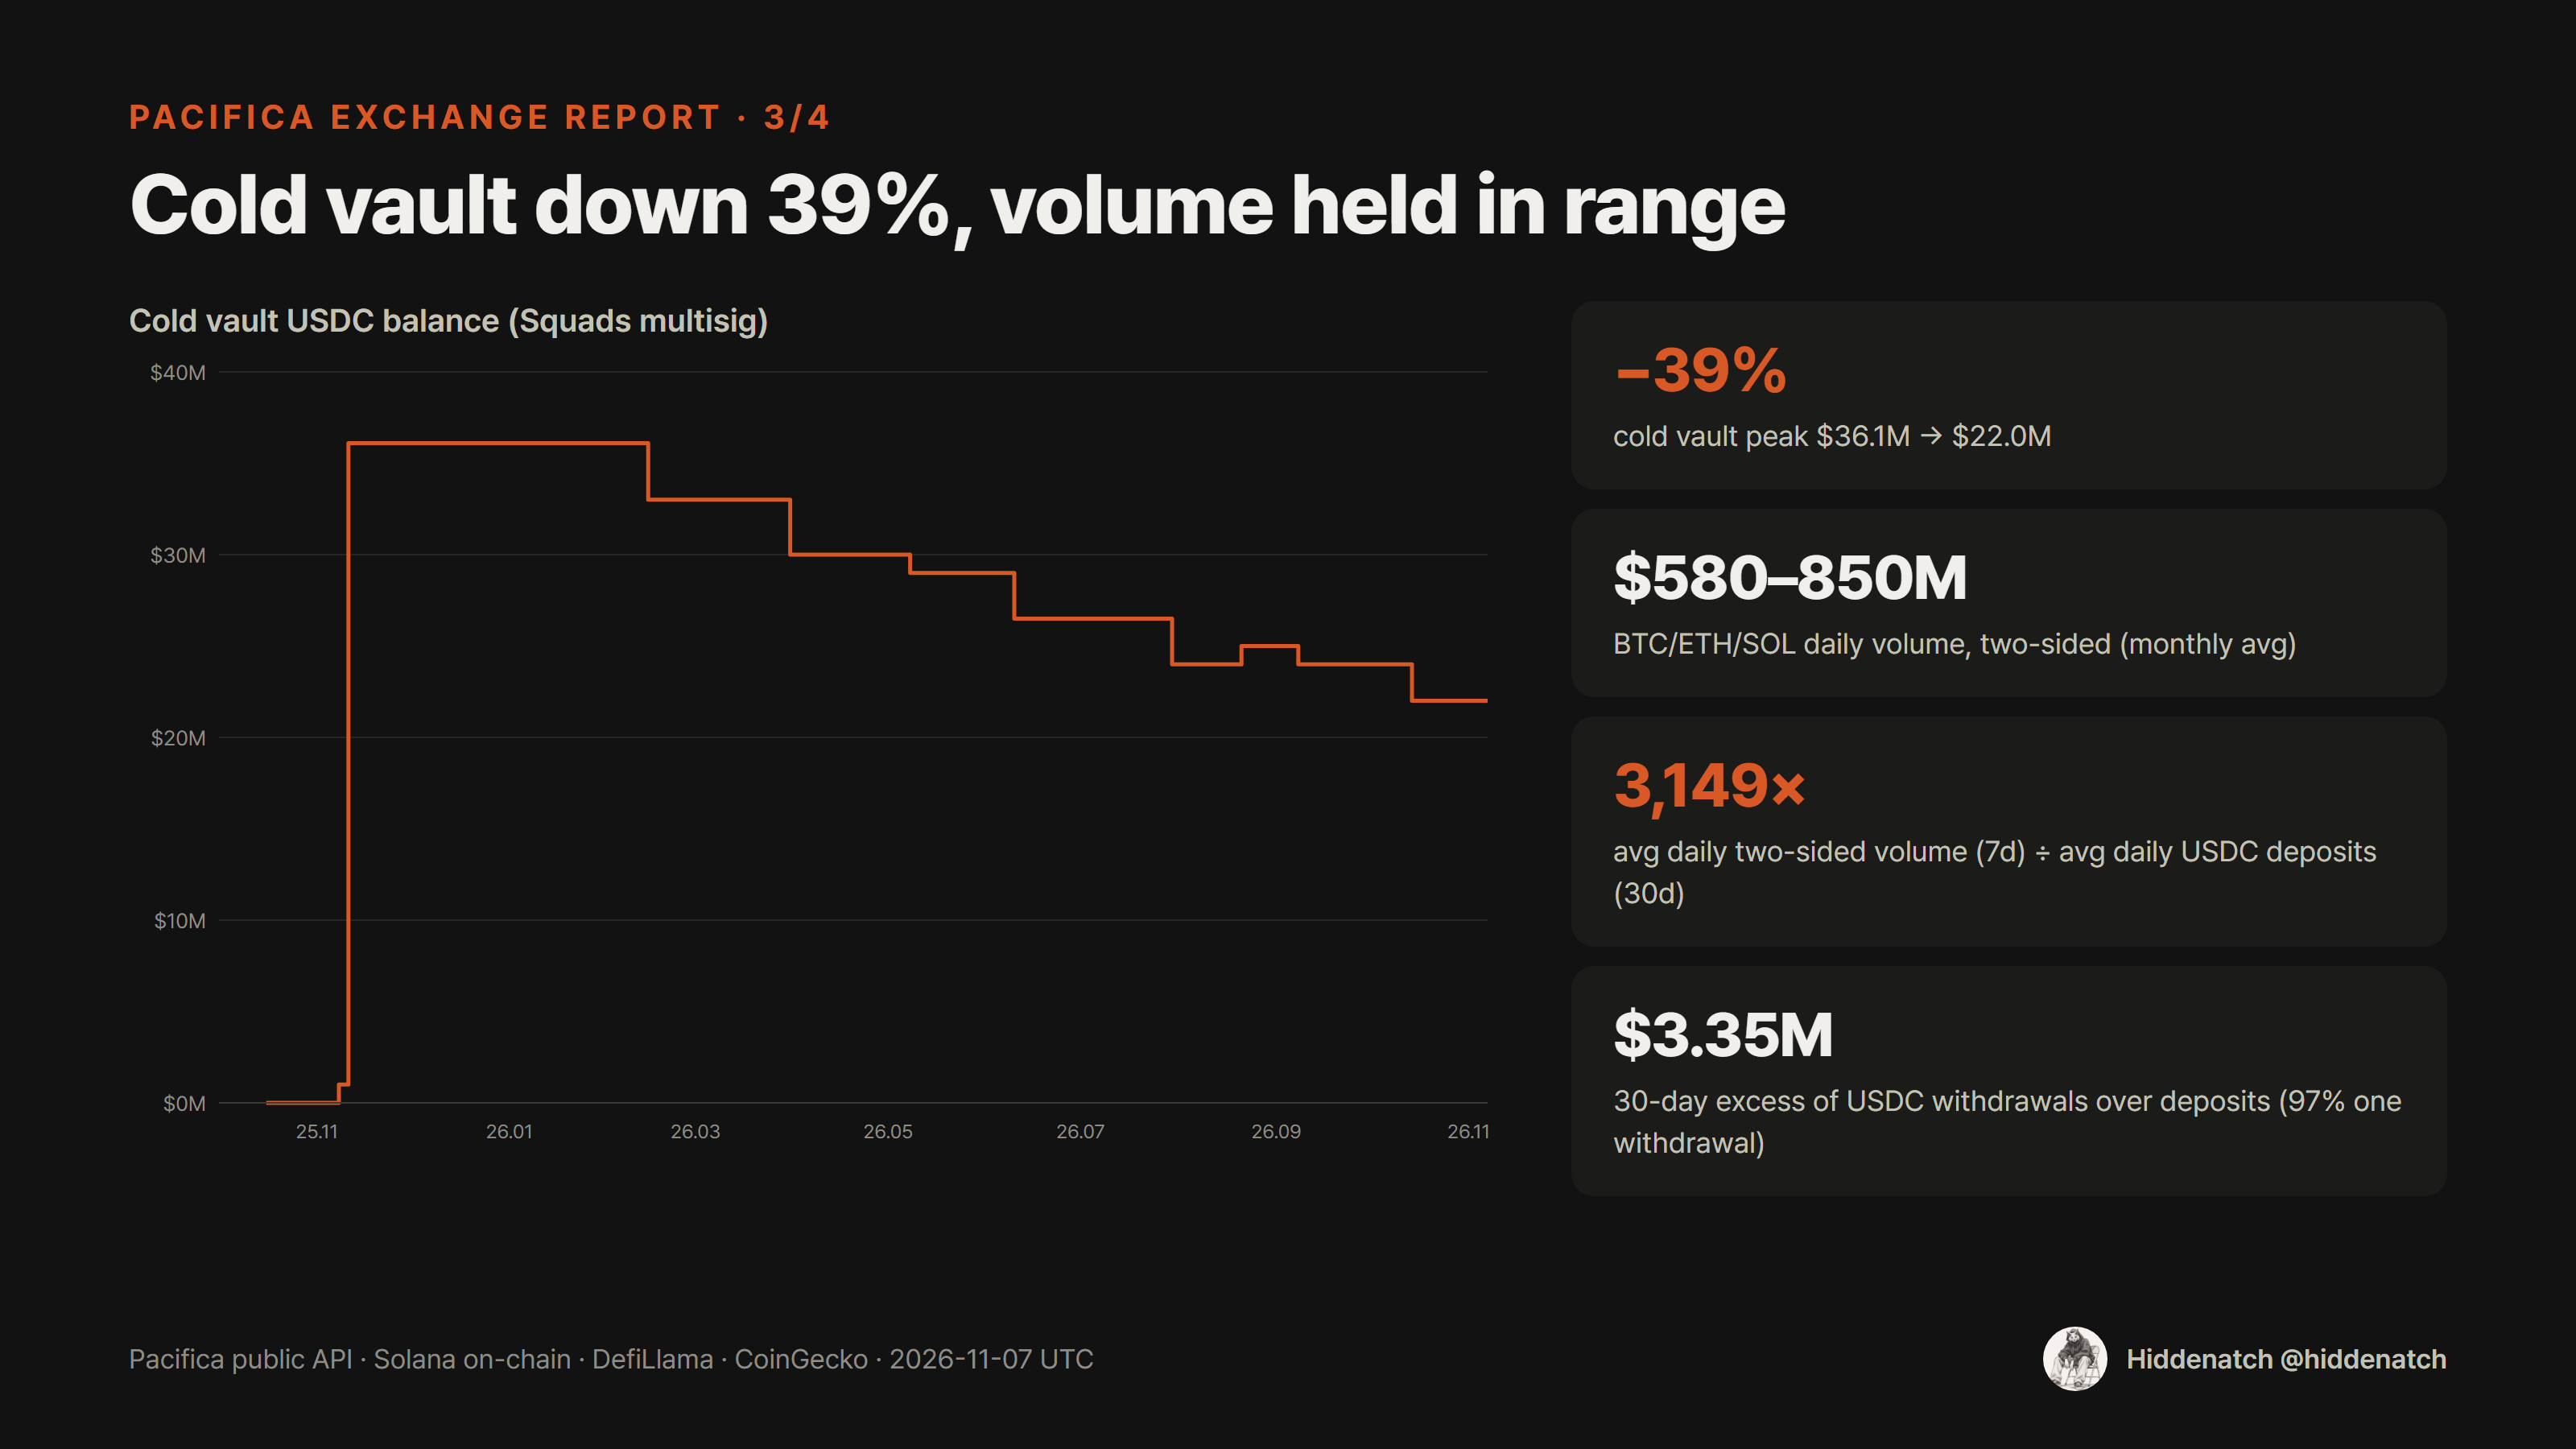
- The cold-vault balance fell while volume held. The cold vault dropped 39% from a $36.1M peak to $22.0M while volume stayed in the same range (this alone does not mean total customer balances fell). Average daily two-sided volume over 7 days is about 3,149× average daily USDC deposits over 30 days.
- Groups of accounts appear to share operators. Three $2,000 sub-accounts synchronize same-direction orders 1–2 ms apart and rank #3–5 of 4,225 by volume per dollar of capital. Two market-maker groups have interlocking transfer times.
- Some accounts look like volume bots. Eight small accounts show fills in almost every hour of the day and trade 6–113× their equity per day. This looks like automated, high-turnover trading and may be points/reward farming, but legitimate small market making can also meet this screen. Together they are about 0.3% of 24h market volume.
- Mechanical fill rhythm. Minimum-size fills hit the #1 volume account at multiples of 20.15 seconds — 11,194 of them in about 7 days.
Overview
- Scale. 79 markets; 7-day average volume $754.6M/day (two-sided; $790M–1.03B on weekdays, $350–520M at weekends). BTC, ETH and SOL are about 94%.
- Capital efficiency. With TVL of $23.4M, daily two-sided volume is 19.1× TVL (34–44× on weekdays), the highest among the CoinGecko-reported peers.
- Fees. 30-day fees $3.48M, revenue $3.45M. The fee rate is a steady 1.5–1.6 bp of two-sided volume.
- On-chain. Matching is off-chain; Solana records only deposits and withdrawals (~150 a day). Most deposits sit in a Squads multisig cold vault.
- Who trades. About 80% of top-40 volume comes from market-maker-type accounts. In our sample there was no fund link between operator wallets and trading accounts.
1. Overview and data structure
Pacifica is a Solana-based perpetual futures exchange. Order matching and positions are off-chain; its Solana program records only deposits and withdrawals (mostly USDC). The program handles about 148 transactions a day, and all 60 sampled were Deposit or BatchWithdraw. Creating sub-accounts and moving funds between them also happens off-chain through signed API requests.
This report therefore combines two sources: on-chain data for deposit size and composition, flows and wallet funding, and Pacifica’s public API for market volume, the leaderboard, per-account fills, balance history and the public trade tape.
| Role | Address | Notes |
|---|---|---|
| Deposit vault (hot) | 72R843…RHTa | USDC $1.3M, ~150 deposits/withdrawals a day |
| Cold vault | FvGqoz…mUeJ | USDC $22.0M, 29 transactions |
| Cold vault owner | 5kwCMK…MoVc | Squads multisig (3 signers) |
| SOL treasury | 9sSr35…YgYu | 1,673 SOL |
| Withdrawal signer | FHFvAv…nQ8r | signed all 175 BatchWithdraws |
2. Scale: volume and open interest
Pacifica’s volume_24h and candle volume count both taker and maker sides, and open_interest adds longs and shorts (DefiLlama halves both). All volumes in this report use this two-sided basis; the actual traded amount (one-sided) is half. OI is shown per side (long or short).
At the snapshot (a Saturday), 24h volume was $446.1M (two-sided; $223.0M one-sided) and OI was $56.2M per side. The last seven daily candles sum to $5.28B, an average of $754.6M/day (two-sided). Of 79 markets, BTC, ETH and SOL make up about 94% of volume.
Weekdays run $790M–1.03B/day and weekends $350–520M (two-sided): volume falls about 54% at weekends on average, moving with market activity.
Since October 2025, monthly BTC/ETH/SOL volume has moved within $580–850M/day (two-sided).
3. Capital efficiency: volume relative to TVL
Daily two-sided volume is 19.1× TVL, and 34–44× on weekdays ($790M–1.03B/day); one-sided it is 9.5×. OI (per side) is 2.4× TVL. Against Hyperliquid (0.6×) and Lighter (1.4×), the same deposits support far more trading. High leverage, fast turnover, market-maker activity and reward programs can all contribute, but it is the highest of the CoinGecko-reported peers, and even if those peers are one-sided and we use Pacifica’s one-sided 9.5×, it is more than 10× Hyperliquid and Aster and 7–8× Lighter and Extended — a red flag.
Peer figures are CoinGecko 24h volume ÷ DefiLlama TVL (2026-11-07). Volume definitions (one- vs two-sided) may differ by venue, which limits how ranks and gaps can be read. Pacifica is 19.1× two-sided (9.5× one-sided). EVEDEX (volume 290×, OI 473×) and Paradex (reported ~$1.8M/day volume) were excluded because their figures look abnormal.
4. Fees and revenue
DefiLlama sums the fees actually paid on every fill from Pacifica’s protocol-wide fill feed. Over the last 30 days fees were $3.48M and revenue (fees − maker rebates) $3.45M; rebates are under 1%.
Daily fees are a very steady 1.5–1.6 bp of two-sided volume (3.0–3.2 bp one-sided) — about 55% of the list rate (4 bp taker + 1.5 bp maker, at most 5.5 bp per trade), plausible after tier discounts. By the same arithmetic, fee-free volume can be at most about 45% of the total (an approximation ignoring liquidation fees and similar exceptions).
What stands out is revenue relative to deposits. Annualized, 30-day revenue is 179% of TVL — about 14× Hyperliquid (13%) and 6× edgeX (31%). Fees over the last 30 days alone equal about 15% of current TVL (not any individual user’s burden). Users are paying very large fees relative to their deposits, which is hard to explain without a strong motive such as points or an expected airdrop.
Effective fee rate by account (last 7 days, vs the account’s own fill notional = two-sided basis)
| Fnsf | -0.50 bp |
| 2rEE | 0.16 bp |
| CW5r | 0.23 bp |
| HDw3 | 0.76 bp |
| AuQb | 1.18 bp |
| 5jW9 | 2.04 bp |
| 7kej·78T6·F7DC (family A takers) | 3.17 bp |
| EnK7 | 3.80 bp |
Top market-maker-type accounts pay only 0.2–0.8 bp. With a 1.5 bp average on the same basis, the large off-leaderboard flow may pay above-average fees (an estimate).
5. On-chain money: how much, and how it moves
Deposit composition. Hot deposit vault $1.3M, Squads multisig cold vault $22.0M, SOL treasury 1,673 SOL — matching DefiLlama TVL of $23.4M. The team moves round amounts between hot and cold vaults, which is why the cold vault holds exactly $22,000,000.00.
Cold vault trend. From a peak of $36.1M on 2025-11-11 it has seen net outflows to the hot vault and now holds $22.0M (−39%). Over the same period volume stayed in a similar range. There is no long TVL history, so this does not by itself mean total customer deposits fell.
Flows (last 30 days, every deposit-vault transaction). Window 2026-10-08 16:13 – 2026-11-07 16:13 UTC; successful transactions deduplicated by signature. 2,471 USDC deposits totalling $7.2M ($240k/day, measured as USDC received by the hot vault) and 1,923 withdrawal transactions totalling $10.5M ($351k/day; 2,005 recipient credits): withdrawals exceeded deposits by $3.35M. 97% of that gap is the single withdrawal below; without it the gap is about $0.1M. A $2.0M cold-to-hot vault transfer (internal rebalancing) is excluded. 1,120 depositor wallets (owners of the source token accounts whose USDC decreased); 1,772 wallets moved money in or out.
Average daily two-sided volume over 7 days ($754.6M) divided by average daily USDC deposits over 30 days ($240k) is about 3,149×. It compares volume and inflows over different windows and is not a capital-turnover measure, but it shows how large volume is relative to new money coming in.
Deposit concentration by source wallet. The median deposit is $134.9, yet one source address (4TYEjn9P…, $7.2M 7-day volume) put in $3.0M over 59 deposits — 41% of 30-day deposits; the top 10 account for 64%. These are gross inflows, not fresh external capital: the same address withdrew $3.30M in 58 transactions, a net outflow of $349,842. Only 4 of the top 20 accounts by 7-day volume directly matched a 30-day deposit source; the others may be funded from other addresses or by off-chain sub-account transfers, so this comparison alone does not show how they are funded.
Largest withdrawal. At 2026-10-14 15:45 UTC, $3.2M (31% of 30-day withdrawals) went in one transfer to GHiRwT…, a wallet not on the leaderboard. Following the trace, about 2.4 minutes later it moved to an account owned by 9qbtun…, then about 4.9 minutes later to one owned by 5tzFki…, the suspected large-exchange wallet seen earlier. This is consistent with an exchange-deposit forwarding route; beneficial owner and purpose are unconfirmed, and no operator-address link was found within the reviewed scope. GHiRwT… also received tiny transfers from look-alike addresses, consistent with address poisoning.
Funding of top wallets. We looked up 38 wallets among the top-40 accounts by 7-day volume and traced 396 transactions (oldest and newest, up to 24 per wallet) of the 25 with signatures. Five top-20 wallets got their first USDC from the same address, which appears to be a centralized-exchange withdrawal wallet (it moved $732.8M USDC and 155k SOL in one go on 10/29). In this sample there was no fund link between Pacifica operator addresses (withdrawal signer, multisig members, cold vault, SOL treasury) and trading accounts.
Large accounts with no chain footprint. The #4 account by 7-day volume, 5jW9… ($672k equity), and family A below have zero Solana signatures. Accounts funded only by sub-account transfers cannot be traced on-chain.
6. Who trades
Leaderboard coverage. Per-account leaderboard volume closely matches summed fills (#1 account: $39.20M vs $39.28M over 7 days). Yet all 6,586 accounts together are only a small part of market volume:
- Rolling 24h: leaderboard $12.3M ÷ market $446.1M = 2.8%
- 7 days: leaderboard $211.4M ÷ market $5.28B = 4.0% (window edges differ by a few hours)
- Tape match: the top-12 accounts made 4.6% of a 22–27 minute tape, implying about 7.6% for the whole leaderboard (estimate)
The leaderboard includes sub-accounts, market makers, vaults and privacy-mode accounts, so ‘a whole category was left out’ does not fit either. The public tape has no account field and per-account lookups need an address, so the accounts behind 90%+ of the volume cannot be identified through public endpoints — a low level of transparency relative to the volume reported.
In/out wallets missing from the leaderboard (full lookup). We matched all 1,772 wallets that sent money to or received money from the deposit vault in the last 30 days against the leaderboard: 1,521 are on it and 251 are not. Looking up all 251, only 15 traded in the last 7 days, for a combined $12.9M — 0.24% of 7-day market volume. Adding them to the leaderboard explains about 4.2% of volume. Even combining the leaderboard with this lookup of hot-vault flow addresses, most volume remains unattributed. This alone does not show that the remaining accounts had no on-chain deposits or withdrawals (sub-accounts, other tokens and other paths were not tested).
Large accounts outside the leaderboard (red flag; coverage needs clarification). 9g8z1Q4F… ($7.1M in 7 days; all 981 queried fills are taker fills) and Aj79C5zs… ($5.3M) are about #7- and #11-sized against stored leaderboard 7-day volumes (query times differ by a few hours, so not a synchronized ranking). Both have deposits going back to mid-October, so they are not brand-new. 9g8z1Q4F… deposited about $17k over 13 deposits in 30 days, yet traded more than 400× that in 7 days. The leaderboard's inclusion rule and refresh timing are not established by public data, and absence alone does not mean improper exclusion.
Structure of the top 40. We pulled every fill of the top-40 accounts by 7-day volume over 24 hours. Together they are 2.3% of 24-hour market volume ($9.2M ÷ $401M, a comparison); 79.7% of their volume came from market-maker-type accounts (maker share ≥ 60%) and 13.0% from taker-type accounts (≤ 40%). The #1 account HDw3 is 78% maker. For 35.4% of top-40 volume the counterparty was also a top-40 account.
Account families
Matching sub-account transfer times and synchronized trading mechanically reveals three groups that appear to be run by single operators. In a 24-hour sample, fills inside each family are 0–0.1% — they barely trade with each other. Owners are unconfirmed.
| Family | Accounts | Why we group them | 7d volume | Internal fills (24h) |
|---|---|---|---|---|
| A | Fnsf·7kej·78T6·F7DC (+GiYch) | $2,000 sub-account transfers in the same millisecond; three takers synchronize same-market, same-direction orders with a 1–2 ms median lag (7 days, ~850× chance); near-identical positions | $7.4M | 0% (0 in 7d) |
| B | GTU92n·F5BcMN·DCmDxh (85–97% maker) | Seven clusters of near-simultaneous transfers, three with all three accounts within a minute (e.g. 2026-04-22 18:54:35 GTU92n +$250k → 18:54:54 DCmDxh +$55k → 18:55:11 F5BcMN +$40k) | $11.2M | 0.1% |
| C | BEE8eP·BEE9ev (100% maker) | Of 61 near-simultaneous transfer clusters (2026-01 to 10), 55 contain equal-and-opposite amounts; both addresses start with “BEE” | $1.8M | 0% |
Synchronization was measured on taker orders only, to remove the effect of one large order filling several makers at once.
Bubble map: how accounts connect
Bubble size = 7-day volume (external wallets fixed), colour = account type. Click a bubble for details; toggle line types to see each kind of evidence. Drag to move, scroll to zoom.
What the lines mean: trade lines are inferred one-to-one matches (price, size, millisecond) between top-40 accounts' 24h fills — one-sided notional, pairs ≥$5k, ambiguous matches dropped. Funding lines are USDC transfers seen in a sample (oldest and newest txs per wallet), not full funding histories. Vault lines are that owner address's 30-day USDC flows only; off-chain sub-account transfers are excluded. Off-leaderboard accounts show 7-day figures.
Account explorer
Top-40 accounts plus family members and large off-leaderboard accounts. Click a header to sort, a row to find the account on the bubble map.
| Rank | Account | 7d volume | Equity | 24h volume | Maker | Fee | Orders | Hours | Tags |
|---|
7. Trading patterns
① Synchronized trading in family A (red flag). The four accounts that each got $2,000 about 25 days ago traded $5.8–6.8M each over 30 days. Ranking the 4,225 accounts with starting capital (equity − all-time PnL) of at least $100 by 30-day volume ÷ capital, the maker account Fnsf is #2 (3,421×) and the three takers are #3–5 (2,890–3,074×); the median is 0.4×. The three takers order in the same direction almost simultaneously (94% of matched orders within 0.1 s, median size ratio 1.0) and hold near-identical positions (at entry price: BCH short ≈$1.9k, PUMP short ≈$1.9k). They did not trade with each other; their main counterparty was the large MM CW5r…. This fits one strategy run across several accounts at once to multiply volume and activity (also consistent with points/reward farming; motive unconfirmed). Together they traded about $7.4M over 7 days, about 0.14% of 7-day market volume.
② Minimum-lot fills every 20.15 seconds (red flag). On the public tape, BTC/ETH/SOL taker-order gaps cluster at 20 s and 40 s because minimum-size fills (ETH 0.0001, SOL 0.01, BTC 0.00001) repeat at multiples of 20.15 s. The #1 account HDw3 received 11,194 such fills as maker across six markets in about 7.1 days, with 45–62% of gaps (by market) within ±0.5 s of a 20.15 s multiple. At $0.2–14 per fill the volume share is negligible; the taker and purpose are not identifiable from public data.
③ Sliced orders (normal). Large same-direction orders of nearly identical size follow each other (e.g. a $201,649 BTC sell, then $201,652 44 s later), consistent with time-sliced (TWAP) execution. In a 26-minute sample there was essentially no ping-pong of equal-size orders flipping direction.
④ Tape and candles agree (normal). Polling the public BTC/ETH/SOL tape every ~2 s for 22–27 minutes and comparing it with 1-minute candles gave 100.0% / 99.7% / 98.4%. Public candle volume is backed by public prints.
④ Suspected volume bots (red flag). In the last 24 hours of fills of the top-40 accounts, 8 accounts meet all four conditions: fills in at least 23 of 24 hourly bins, 200+ distinct filled orders, equity under $30k, and 24h volume at least 5× equity. This looks like automated, high-turnover trading and may be points/reward farming. Legitimate small market making can also meet this screen, and a large operator using small sub-accounts would not be filtered out. All four family-A accounts (three takers plus the maker Fnsf) qualify, and the two small maker-rebate (−0.5 bp) accounts B8gc… and Fnsf… both have a $13 median order. Together the eight traded $1.28M in 24 hours, about 0.3% of the $401.4M market volume over the same window. Volume caught by this rule cannot explain total volume; farming and operators are unconfirmed.
| Account | 24h volume | Equity | Volume ÷ equity | Taker | Effective fee | Median order |
|---|---|---|---|---|---|---|
Fnsf…oRJg | $287k | $3k | 113× | 0% | -0.5 bp | $13 |
BMwY…WGE9 | $116k | $4k | 30× | 3% | -0.4 bp | $386 |
7kej…XoRU | $110k | $5k | 24× | 100% | 3.0 bp | $251 |
B8gc…g9Ej | $327k | $22k | 15× | 0% | -0.5 bp | $13 |
78T6…JuEs | $77k | $5k | 15× | 100% | 3.0 bp | $210 |
F7DC…fwVs | $78k | $6k | 14× | 100% | 3.0 bp | $239 |
4og8…UL2o | $123k | $10k | 12× | 49% | 1.8 bp | $179 |
AN2M…pfpN | $160k | $27k | 6× | 0% | -0.5 bp | $50 |
8. Checkpoints
| Item | Observation | Rating | Reading |
|---|---|---|---|
| Revenue vs deposits | Annualized revenue = 179% of TVL | Red flag | Far above peers (7–31%); implies a strong motive to absorb fees, such as rewards Evidence → |
| Volume vs deposits | Daily two-sided volume = 19.1× TVL (34–44× on weekdays) | Red flag | #1 in the table (GRVT 12.5×, Hyperliquid 0.6×, as reported by CoinGecko); still near the top at 9.5× one-sided Evidence → |
| Transparency of traders | Leaderboard = ~3–8% of market volume | Red flag | All 251 off-leaderboard addresses with 30-day vault flows add only +0.24 pp. The accounts behind most volume cannot be identified publicly Evidence → |
| Leaderboard completeness | Addresses sized like #7 and #11 by 7-day volume are missing (active since mid-October) | Red flag | Inclusion criteria and refresh timing not established; absence alone does not mean improper exclusion Evidence → |
| Deposits vs volume trend | Cold vault −39%, volume in the same range | Red flag | No long TVL history, so total deposits may not have fallen as much Evidence → |
| Multi-account operation | Three account families; three sub-accounts synced 1–2 ms apart | Red flag | Internal fills 0–0.1%; signs of joint operation or shared strategy Evidence → |
| Suspected volume bots | 8 small, high-turnover accounts with fills in almost every hour (24h $1.28M) | Red flag | Automated high-turnover trading; possibly farming, possibly small MMs. About 0.3% of the market Evidence → |
| Mechanical fill rhythm | Minimum-lot fills on a 20.15 s rhythm, 11,194 of them | Red flag | Negligible volume; owner and purpose unknown Evidence → |
| Fee structure | Effective fee a steady 1.5–1.6 bp (two-sided) | Normal | Most volume pays real fees; fee-free share at most ~45% Evidence → |
| Volume data consistency | Public tape = 98.4–100.0% of 1-min candles | Normal | Candle volume is backed by public prints Evidence → |
| Weekend volume | Down about 54% at weekends | Normal | Moves with market activity Evidence → |
| Operator wallets and traders | No fund link in our sample | Can’t tell | Matching and sub-account transfers are off-chain, so on-chain data cannot settle it Evidence → |
9. What Pacifica does well, and what it is building
Most of this report is about what looks unusual. But several things check out, and Pacifica keeps adding products. The points below come from our own checks and Pacifica's public docs (read Nov 9, 2026).
What holds up in our checks
- Vault money is traceable on-chain. The hot vault, the Squads-multisig cold vault and the SOL treasury add up to DefiLlama's TVL. Sub-account transfers happen off-chain and can't be traced this way.
- Fees are steady. Daily effective fees were about 1.5–1.6 bp of two-sided volume from Oct 24 to Nov 6, 2026.
- The public tape agrees with the candles. In 22–27-minute samples on Nov 7, public BTC/ETH/SOL prints accounted for 100.0% / 99.7% / 98.4% of 1-minute candle volume.
- Maker protection and self-trade prevention are documented. Market orders and GTC/IOC limit orders get a randomized 50–100 ms delay. If a new order would match a resting order from the same account, the resting order is cancelled.
- Security measures are documented. The docs list a BlockSec audit of the perp contracts, with a report filename dated April 24, 2025, and a Bug Bounty Program page. The Oct 8, 2026 API changelog states that withdrawals from accounts with 2FA enabled require 2FA proof.
What Pacifica has been building
- Print. Pacifica describes it as limit-style orders that pay yield while they wait to fill. Per the docs, you choose a direction and a target price, lock a deposit as margin with leverage, and receive a payout from the Print liquidity pool at the start of each cycle. Cycles are 24 hours (BTC also has 7- and 30-day cycles), and fills are checked only at the end of each cycle. It lists 10 markets, including BTC, ETH, SOL and HYPE. An API endpoint for placing Print orders was added on Oct 17, 2026.
- Neptune. Listed on the homepage as an AI trading workspace, "Agentic trading, reimagined", for automating research, building workflows and executing strategies. The site doesn't state its availability.
- Order strategies. The Sep 13, 2026 API update added OCO, conditional orders, trailing stops, chase, swarm, trigger swarm and TWAP.
- More of the stack. According to the API changelog: spot trading, unified margin and lending (Apr 23, 2026), vaults (May 4), MCP server package documentation (Jun 30), and 2FA and notifications (October). The homepage also links an Android app.
Open point: the docs name the Print liquidity pool as the source of Print payouts, but don't say how that pool is funded. Dates above are documentation and changelog dates, not necessarily launch dates.
10. Limitations and next steps
- Global fill feed not used. The protocol-wide fill feed requires browser headers (User-Agent, Origin), so we did not use it.
- Sub-account structure. Parent/sub-account lists need a signed private request and cannot be linked from outside.
- Samples. 7-day fills for 11 accounts, 24-hour fills for the top 40, a 22–27 minute tape, up to 24 transactions per traced wallet. Ratios vary by window.
- Peer definitions. CoinGecko volume and DefiLlama TVL definitions may differ by venue.
- Next. Repeated leaderboard vs market reconciliation on identical end times; whether volume and fees track points-season dates; applying the same method to other venues.
Appendix A. Methods and sources
- Pacifica public REST:
/info,/info/prices,/leaderboard,/trades,/trades/history?account=,/account/balance/history,/positions,/kline, within rate limits and without browser impersonation. - Solana mainnet public RPC:
getSignaturesForAddress,getTransaction,getAccountInfo. - DefiLlama TVL / fees / revenue APIs and adapter source; CoinGecko derivatives exchanges.
- Flow tally: all 30-day signatures of the hot-vault token account, 4,397 transactions deduplicated by signature, classified by Deposit/BatchWithdraw logs, with the hot vault's USDC balance change as the amount. Depositor = owner of the source token account whose USDC decreased; recipient = owner of the token account that received USDC. Addresses not on the leaderboard were looked up with
/trades/historyfor their 7-day fills. - Counterparty matching: one taker and one maker fill with the same symbol, price, size and millisecond in opposite directions (ambiguous keys dropped). No shared fill ID exists, so these are estimates.
Summary images for sharing